In September of last year Poly released a new reporting capability, RealConnect Tenant Report, which is available to all RealConnect Service customers. It includes a customizable dashboard of tiles which provide critical usage stats, helpful charts and graphs to indicate things like historical concurrency numbers or average call duration, and the ability to view and export individual call details.
The data included in this reporting portal is only gathered from calls placed by standards-based SIP and H.323 endpoints to the RealConnect Service, which in turn bridges the call into a Microsoft Teams or Skype for Business meeting. Details related to native Microsoft clients and devices, as well as PSTN attendees in these same meetings can be found in Microsoft reporting tools like the Microsoft Teams activity reports.
Accessing the Portal
While the back-end reporting system is part of the primary Poly Cloud Services (PCS) administration portal, the RealConnect Tenant Report portal was previously only accessible by going directly to: https://rc-reports.plcm.vc. Recently though the various Poly service portals have been more closely integrated and the reporting portal is now available from within the primary administration portal: https://console.plcm.cloud. This provides a single sign on and single entry point to access the various administration and management utilities for the RealConnect Service as well as some other Poly cloud service offerings.
In order to access the reports an account must be granted permissions first. By default a primary contact email address would have been provided to Poly during the original order of RealConnect licenses. That contact would have automatically been sent an invitation email to activate their account.
Activate Initial Account
This portion can be skipped if access to PCS has already been activated for the initial administrator. If not, then locate the email entitled Welcome to Polycom Cloud Service Administration which would have been sent from the address cloud-service-team@polycom around the time of the initial RealConnect license order. The Activate Your Account button in the message body can be used to activate the account. (The “No account? Create one” link on the PCS portal is not applicable here and cannot be used to request an account. If an the account is unknown or the invitation email cannot be located then contact Poly for additional assistance accessing your tenant.)
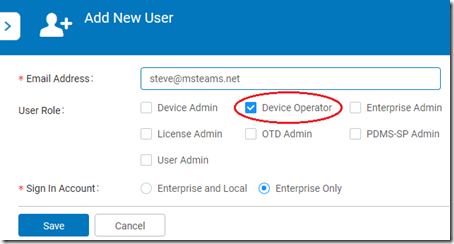
The initial administrator account can be used to access the reporting portal, but the minimum requirements are the User Role called Device Operator. To grant reporting access to other users in your organization simply adding a new user in the PCS portal under Administration > Users and grant the Device Operator role. The user will automatically receive an invitation email to the provided email account.
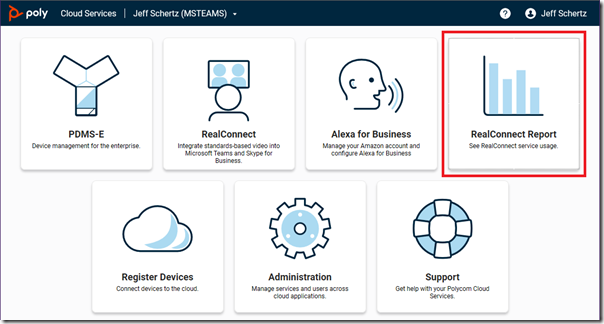
The RealConnect Report tile on the Poly Cloud Services home page can be used to access the reporting portal.
If that tile does not appear as a choice in the menu then simply go to https://rc-reports.plcm.vc to access the site directly.
Dashboard
The portal menu is comprised of two main sections: Dashboard and Calls. (The RealConnect Invite Add-In menu can be ignored as it has nothing to do with the reporting portal and is simply a download link for a scheduling plug-in available for the service. This may be relocated to a different Poly website at some point.)
Once signed into the portal the main Dashboard page will appear which by default display information based on the last 7 days of activity. The drop-down menu in the upper left corner of the dashboard can be used to select the displayed time frame among the following options: Today, 24 Hours, Week, Month, Three Months, Six Months, and Year.
Call Summary
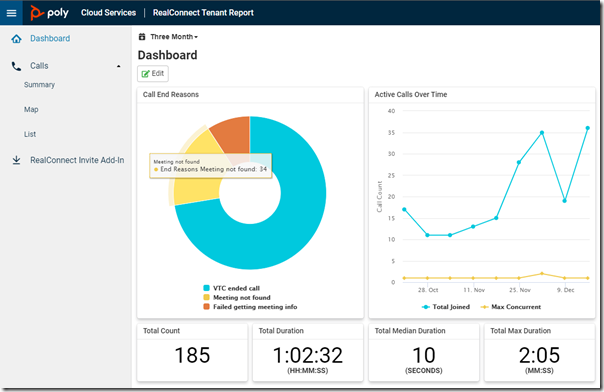
Among the available widgets the most helpful when starting to troubleshooting call connection failures can be the Call End Reason and Active Calls Over Time chart.
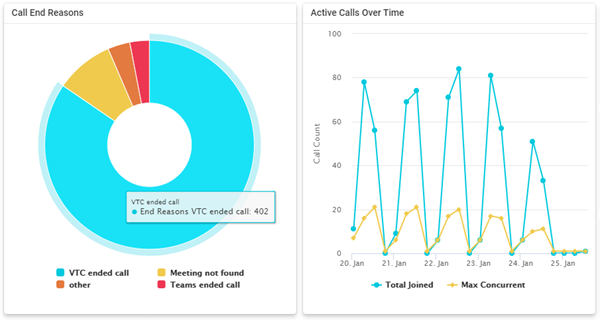
On the Call End Reasons pie chart the value “VTC ended call” should be the most common event, which simply indicates that something other than the service ended the call. This most often is someone in the conference room simply hanging up the call, but this result could also include unintended disconnections caused by either the endpoint or transversal solutions like video registrars and corporate firewalls. Other common values are “Failed getting meeting info” which could represent an incorrectly formatted call string, or “Meeting not found” which is usually when someone enters an incorrect or expired VTC conference ID in the call string or when prompted at the service’s entry queue.
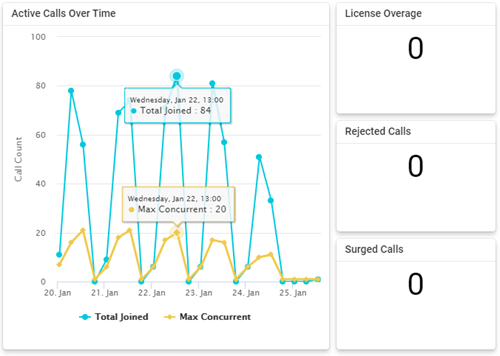
The Active Calls Over Time graph shows two sets of overlaid data points: “Total Joined” which is an aggregate number of all successful endpoint connections across all meetings for the data point on the graph, and “Max Concurrent” which is the maximum level of concurrent connections allowed into the service for all of the tenant’s meetings which may be active at that time. Clicking on the name of either value in the legend will hide/show that data line on the graph, which is helpful in rescaling the Call Count axis on the chart to better view one value over the other.
Call Concurrency
As the service is licensed on call concurrency then understanding how calls are accepted and rejected due to license availability is critical.
There are 3 important metrics to understand which are related to call acceptance behavior during maximum concurrency events:
- License Overage: The total number of calls attempted during a time when all available concurrency licenses are already in use.
- Rejected Calls: The total number of calls rejected for lack of an available license at that time.
- Surged Calls: The total number of calls which were allowed to join the meeting in spite of license capacity being reached.
The first two items are self-explanatory but Surged Calls warrants some additional detail. The RealConnect Service includes a feature called “Soft Ceiling” which means that when a tenant’s license capacity has been reached the service will still allow calls to connect for up to an additional 50% of the existing license capacity. Thus, if a tenant has purchased 50 licenses then their true ‘hard ceiling is actually 75 concurrent calls (50+25). In this example allowed call attempts while the current concurrency count is between 50 and 75 will be recorded as Surged Calls. And call attempts placed when above 75 will be rejected and recorded as Rejected Calls.
The one caveat to be aware of though is that this soft ceiling feature is only available for customers with 6 or more RealConnect licenses activated in their tenant. Free trials of 5 concurrent licenses or customer receiving or purchasing 5 licenses or fewer will not have a soft ceiling, meaning the maximum call concurrency will be equal to the number of licenses owned. In this example calls placed while the tenant is a maximum concurrency will be rejected and recorded as Rejected Calls.
The data points on the chart indicate a scope of time, from as little as 1 hour (when viewing data for only a day) to as much as an entire day (when viewing data for a year). This explains why a single plot point on the chart can indicate a Max Concurrent value of 4 when the Total Joined value on the same vertical axis can read as 24 and yet no surged or rejected calls are reported. In a data set for as little as an hour it is possible for several meetings to have occurred with multiple endpoints joining and then hanging up, all without ever reaching maximum concurrency and triggering a license overage event.
Devices
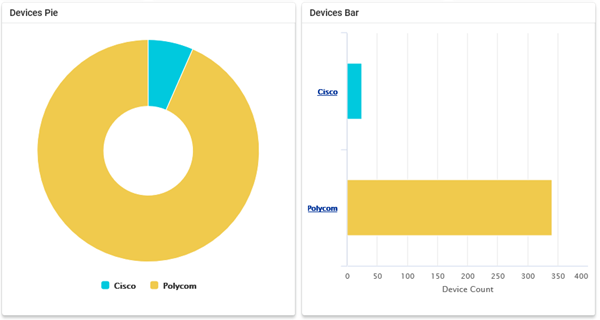
The Devices Pie and Devices Bar charts include categories for each manufacturer based on the names provides in the User Agent strings, which most often identifies the endpoint itself but could actually be based on the type of on-premises video infrastructure used to route the call to the service (e.g. Polycom or Cisco).
Conferences
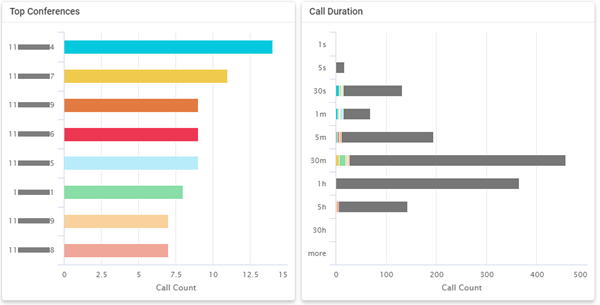
The Top Conferences and Call Duration charts provide a glance at the most attended meetings and how those meetings stack up against all other meetings in terms of duration. Note that Call Duration is not a measurement of the length of the overall Skype or Teams meeting, but simply the length of time a VTC stays connected for each call into the service. The example data below indicates that the majority of calls are roughly 30 minutes to one hour long.
Customization
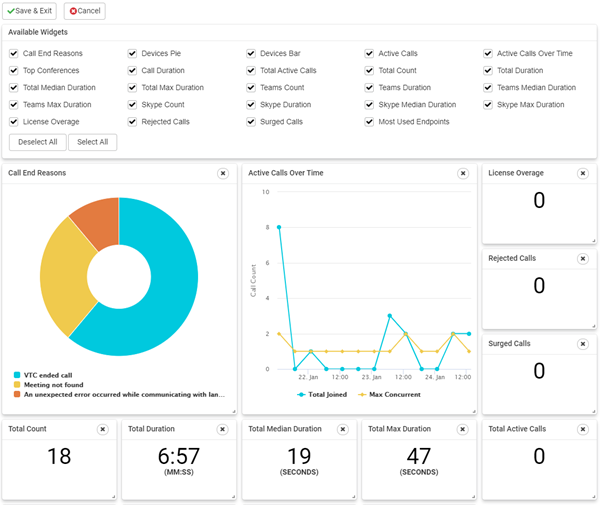
Any of the several widgets on the dashboard can be hidden or rearranged by clicking the Edit button at the top of the dashboard view. For example another column can be created by dragging widgets like License Overage, Rejected Calls, and Surged Calls up from the bottom of the view. Placing these next to the Active Calls Over Time graph makes it easy to see this information without scrolling the screen up and down.
Calls
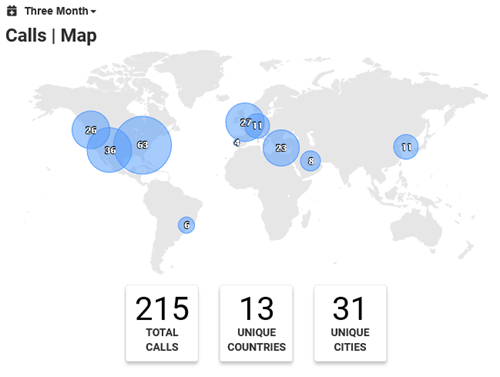
The Calls menu includes additional views into the available call data with a summary page that is very similar to the dashboard view, a graphical map which displays where calls are originating from, and an exportable list of individual call attempts which can be used for additional troubleshooting. All of these views, like the dashboard, can be toggled between the available time frame options from a day to a year.
Summary
This view is similar to the dashboard as it provides a simple view for quickly scanning general statistics. It contains a fixed subset of the total available widgets though so it is a bit redundant to the dashboard.
Map
An interactive map provides geographical totals indicating the source location of calls placed in the selected time frame. For congested areas the bubbles can be clicked to zoon the map in for a closer look at the region.
List
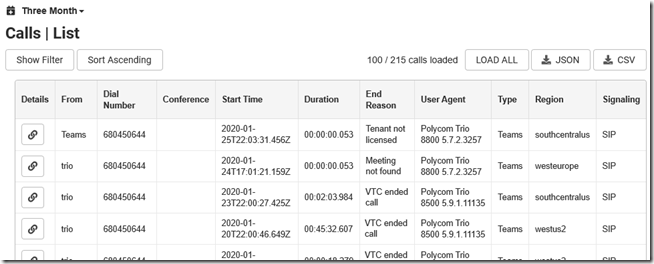
Other than the dashboard this is where most time will likely be spent in the portal: looking at individual call detail records. The default view displays every call, successful or not, which has been attempted into join either a Skype for Business or Teams meeting hosted by that tenant. Calls placed into either the entry queue (<TenantKey>@*.plcm.vc) or directly into a meeting (<TenantKey>.<ConfID>@*.plcm.vc) and recorded here if the tenant’s key matches the key provided in the call string. Calls using an incorrect Tenant Key would not be matched to this tenant and thus would not appear in the tenant’s own reports.
- Regardless of the selected time frame the most recent 100 records from the call log will be displayed by default. Scrolling down to the bottom of the page will load more records into memory and display them on the page, or the LOAD ALL button can be used to load the entire list of call records for the selected time frame. Once the desired set of records are loaded they can be exported into JSON and CSV formats for easier viewing in external applications.
The example above includes various types of common End Reason results which are covered in the next section. What should be obvious from the list above though is that the tenant’s licensing appears to have expired sometime after the last successful call on 1-24-2020.
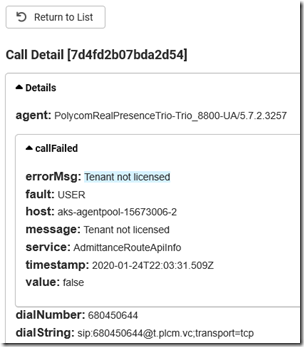
To see additional Call Details information for a specific call in the list click simply the chain link icon in the first column of the table in the desired record. This call did not complete successfully due to a lack of valid licenses in the tenant (either missing or expired) as described in the callFailed section.
The remainder of the call records includes additional information like dial string used in the call attempt, the protocol used (SIP vs. H.323), source location details, timestamps, call end times, the reason the call was ended, and more.
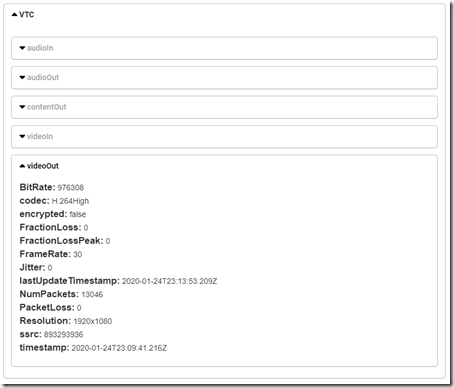
Call quality statistics are also provided in the record but only if the call was successfully connected into a meeting and stayed connected for at least one minute. This data is included in the VTC section and is broken down into additional sections based on media type and direction. The applicable categories include audioIn, audioOut, contentIn, contentOut, videoIn, and videoOut.
As the RealConnect service is the source of this data (not the endpoint) then the directions indicated are from the point-of-view of the service. Thus, “In” statistics are what the service sees coming in, meaning these are streams from the endpoint to the service. “Out” statistics are what the service is sending out, thus streams from the service to the endpoint. As stated earlier this data is only representing the call path between the VTC and the service; any signaling or media statistics related to communications between the service and the Microsoft Skype or Teams platforms as well as those native clients is not included in this portal.
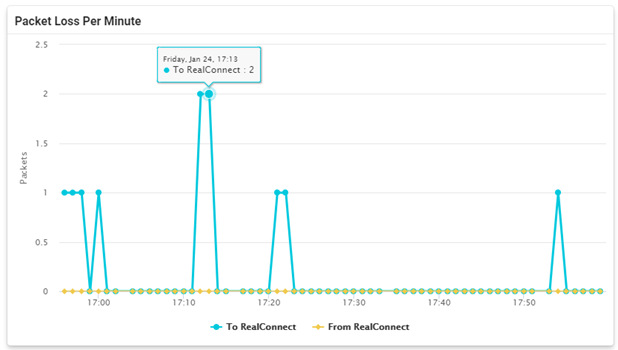
Of all the metrics available in the call data arguably the most important are the packet loss values, given that this service resides in the Microsoft Azure cloud and it most likely reached via the public Internet for most calls. For this reason the call record also includes a chart summarizing Packet Loss Per Minute at the bottom of the page.
This example shows a call which lasted just over one hour that experienced only 11 lost packets, and all occurrences were recorded on the blue ‘”To RealConnect” line.
By reviewing the VTC details in this call a total of 1,365,861 packets were reported as sent/received across both audio and video session. The 11 lost packets all occurred in the videoIn session, meaning they only occurred on the video stream coming from the VTC up to the service.
Additional Examples
Beyond the basic examples shown above there are some other common scenarios which can be identified by reviewing the data on the dashboard or looking deeper into call detail records.
License Overage
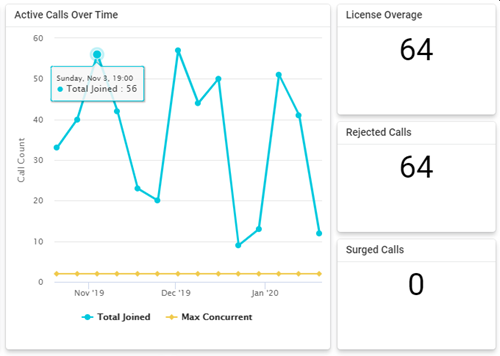
In the this example a tenant has reported that some, but not all of their call attempts into the RealConnect Service are being rejected.
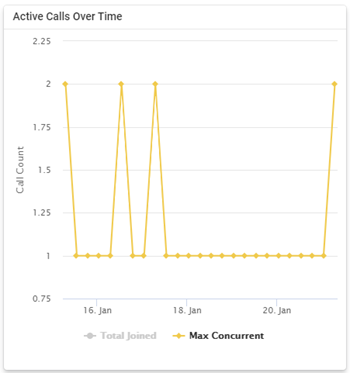
Looking at the Active Calls Over Time graph in the default Week view on the dashboard page the data points appears to indicate that this tenant may only contain 2 concurrent licenses.
Clicking on the Total Joined legend item will hide that data from the graph, resulting in a focused view on the remaining data: Max Concurrent. Note that all data points indicate a Call Count value of either 1 or 2.
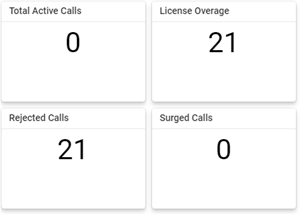
Additionally the following values displayed towards the bottom of the dashboard can be used to understand overage behavior that occurred during this time window. Based on the definitions provided earlier in this article the data below shows that all call attempts which occurred when the tenant was already at license capacity were rejected. If any additional calls had been allowed while at license capacity then the Surged Calls value would not be zero.
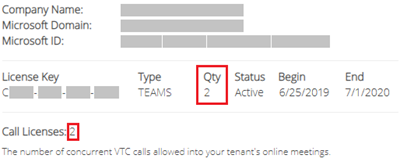
As all signs seem to point to only 2 licenses being available for this tenant then the way to confirm that is to have a Global Administrator for the Office 365 tenant sign into the RealConnect Service’s provisioning portal to view the current licensing status.
In this tenant’s case it may be advisable to add additional RealConnect licenses to address the need for more than 2 conference rooms to use the service at the same time. By switching to a larger data scope like the Three Month view additional historical data can be used to help determine what the appropriate suggested licensing count might be.
In this example it is clear that this tenant needs to add some additional licenses, but to determine how many licenses requires a closer look at the data. The Calls > List menu can be filtered by call events to view ever rejected call.
- From the navigation menu select Calls > List and then click the Show Filter button.
- Under the License Use drop down menu select All Overages and then click Apply Filter.
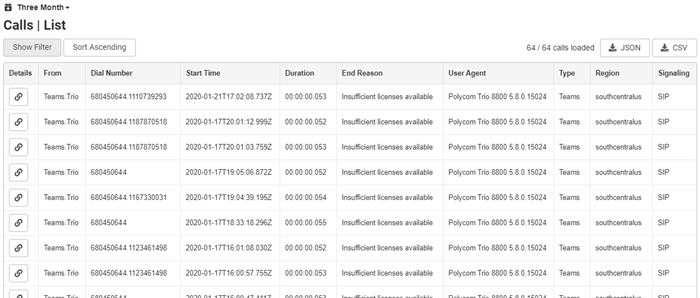
By reviewing the individual calls it can be determined if the 64 overage events in this 3 month time period are indicative of the several conference rooms trying to join the same meeting or different meetings at the same time, or are instead largely represented by repeated failed attempts from the same conference room to join a single meeting.
This data can further be exported into CSV and imported in something like Microsoft Excel to perform additional queries and reporting on to further scrutinize the data for patterns. Something worth noting in the data shown above is that the From field shows the same value in all of these entries. This could indicate that it is the same system placing all of these calls, but given that the value is specifically ‘Teams.Trio’ it is more likely that these are different room systems. The default value for the reg.X.address parameter provided in several configuration templates for the Poly Trio is ‘Teams.Trio’, so one cannot easily decide if these calls are from one or many different Trio installations. To avoid this it is recommended to define a unique name on each Trio to help determine the source of calls into the RealConnect Service.
License Overage with Soft Ceiling
Here is another tenant in a similar scenario of placing calls while at license concurrency but is successfully leveraging the Soft Ceiling feature.
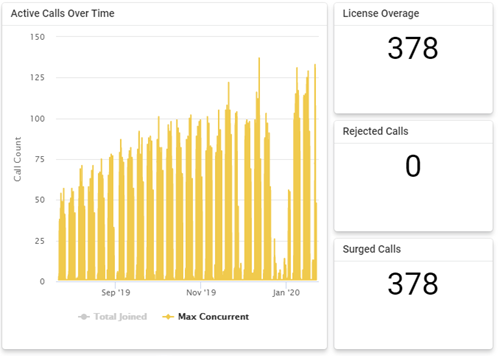
The Active Calls Over Time graph is displayed over a Six Month period, with only the Max Concurrent data visible.
Based on what was explained in the previous example the scenario here shows the majority of maximum concurrent events approaching and eventually exceeding the 100 mark, with a few notable exceptions: peaking sometime in December followed immediately by a massive dip in utilization which occurred during the holidays. The tenant in this example is actually licensed for 100 concurrent connections, and as shown by the graph and the zero value for Rejected Calls they are appropriately sized and currently leveraging the Soft Ceiling feature by staying under the allowed 150 maximum connections. Based on the historical growth though additional licenses will likely need to be added to prevent any calls from being rejected.
This is a fascinating feature – and I got a look at it, briefly, earlier today thanks to this blog post.
As I position our meeting room technology towards a foundation of RealConnect and also OneTouchDial – having real usage statistics will allow licensing decisions to be based on fact rather than winging it. This is also important since we are still in the RealConnect free trial period – and have no idea what the eventual pricing is going to be. Since we are a smaller company – knowing that the Soft Ceiling trigger is 6 licenses could help us since we might have 7 or 8 devices using RealConnect. Perhaps we can safely get away with 6 licenses and surge over it on rare occasions. I wouldn’t have known that without this posting. Thanks!
Adam, glad this article helps. As the reporting is relatively new there are not a lot of people using it yet, but your example is primarily why I wrote this up. Many customers are currently using the “free until June” licensing which provides 1 license for ever Poly device they have. A 1:1 ratio of licenses is massive overkill in most cases, so reviewing your actual usage is a great way to understand roughly how many licenses you’ll actually need once it comes time to purchase some.
Thank you Jeff, a great contribution, as always.
On our tenant we observe a couple of strange messages in the EndReason column, showing up once in a while
– Call did not return after 302 redirect
– The call was redirected to another deployment
Do you have a clue how to troubleshoot those?
I can see that such calls have 1s duration, meaning they obviously didn’t succeed.
As explained in this earlier article all calls initially hit a load balancer pool and are immediately redirected to the best available MCU pool. For SIP calls this is a “302 Moved Temporarily” response sent to the endpoint. If the redirected call fails due to an issue on the endpoint or any traversal systems in the route (like a corporate firewall or video gateway) then our service will not see the expected call come in an then report it as such. The first places I look here are if DMA and/or RPAD are in place this can happen on older versions of software. If Cisco CUCM or VCS is used then their configuration could cause the failure. Regarding corporate firewalls if some but not all of the destination IPs are allowed (also covered in the article linked in my response) then the new destination IP might not be allowed. In short, review the call logs on the endpoint and any traversal products in between it and the Internet (like firewall logs) to see where the call may have been dropped.
Thanks Jeff!
We don’t have DMA or RPAD, but the idea of firewall misconfiguration seems to be valid, considering the random nature of the issue. We’ll take close look at the firewall logs to identify the root cause.
The second event (call was redirected to another deployment) reports that while the initial call arrived in one data center the call was routed to an the MCU pool in another data center region due to a service availability or capacity issue at that time.