This article will mainly serve as a field-reference in which customers can use to follow specific steps to capture SIP diagnostic logging and properly package it for review by anyone other than Microsoft’s Product Support team.
Although there are already a number of how-to articles on using the native logging tools for OCS and Lync Server most cover just the basic process to quickly grab a capture file. This article goes into a bit more depth on the various settings with examples on using filtering and processing trace files from other environments.
Capturing Trace Files
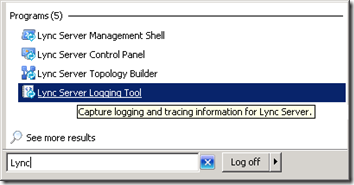
- Locate and launch the Lync Server Logging Tool on the desired Lync Server.
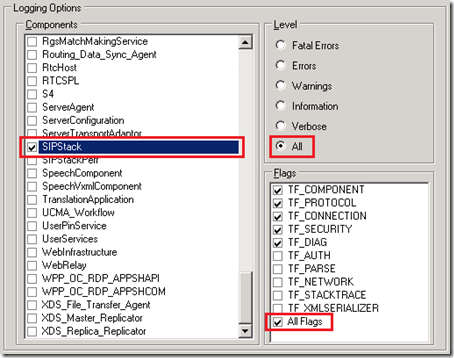
- Select the desired Logging Options to capture in the trace. Most commonly this tool is used to troubleshoot SIP communication errors so the basic settings to start with would be to select only the SIPStack component. (S4 can also be added be may not be necessary; usually PSS will ask for both to be enabled.) In order to capture the most detail possible then All Levels and All Flags should be selected as well. (There is no need to select all of the individual flag checkboxes, simply checking “All Flags” is sufficient.)
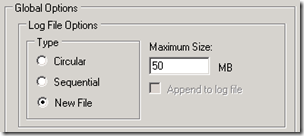
The default Global Options are typically sufficient for a brief capture in a pilot or test environment, but in environments with active users the log files can get large quite quickly, especially when verbose logging is enabled. Since the default Type is set to Circular once the log file reaches the Maximum Size (20 MB) then old data is overwritten; this can make for a unhelpful trace file. Increasing the file size and/or enabling multiple trace files will prevent this situation by retaining all data captured during the trace. Be careful with this setting though as forgetting to stop the trace can eventually use up all available memory on the server. Leaving circular logging enabled the majority of the time is a safer approach.
- Change the Type to New File and increase the Maxiumum Size to 50MB.
- Now data is ready to be logged. Click Start Logging and begin to perform the desired test procedure(s).
Be aware that the server does not start logging data immediately, there is typically a 3-5 second delay before data begins to be recorded. This is not normally noticeable but the behavior can be seen if the Real Time Option is Enabled. Either way it recommended to wait a few second before beginning the test scenario otherwise the initial SIP messages may not be captured.
- Click Stop Logging when the test is completed.
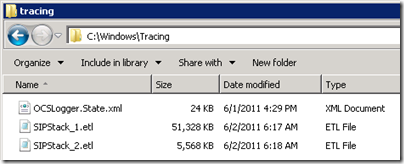
Once the logging has been stopped the trace data stored in memory is then written to one or more Event Trace Log (.etl) files which are saved in the server’s configured Log File Folder (C:\Windows\Tracing by default). This example shows that when the previously set Maximum Size value of 50MB was reached a second log file was created. The OCSLogger.State.xml file also records the logger settings used during the trace (e.g. file option, selected components)
Packaging the Results
If working with Microsoft Product Support then these files can be sent directly to them for troubleshooting as PSS has access to the MSSLogToText.exe tool which is needed to convert the binary based ETL data into readable text. The ETL files will typically compress with a 1:5 ratio so this 50MB file will be under 9MB which should be small enough to be sent via SMTP to most e-mail systems these days.
But for all other uses outside PSS an additional step is required to convert the trace files into text. Using the Logging Tool there are two different options available: View Log Files and Analyze Log Files. Both of these buttons along the bottom of the Logging Tool perform the same initial action: converting the binary ETL data into a flat text file.
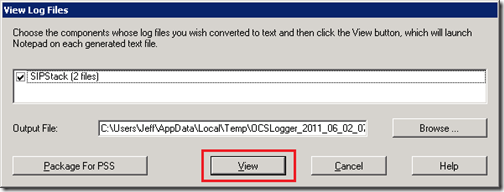
- To simply view the log files in the raw text format select View Log Files from the Logging Tool’s main window and click View on the following window.
Note that the Output File directory is set by default to the current user’s %TEMP% directory, but if desired the directory can be changed to another location prior to converting the file.
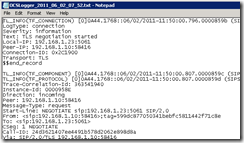
The output file will be opened automatically in the server’s default text editor.
The converted file was automatically saved in the Output File path using a default naming convention for each file of OCSLogger_<year>_<month>_<day>_<UID>.txt. This text file will typically be about three times larger than the binary ETL file. Additionally the flat text file can usually be compressed with a 1:10 ratio since it is just ANSI text data.
For example if a 10MB file is the largest which could be emailed then it is recommended to set a Maximum Size on the Log File Options of about 30MB (30MB .etl = ~90MB .txt = ~9MB .zip).
Reviewing the Results
But if not simply packaging a text file for someone else to review then viewing the log data using Notepad is a quick way to go blind trying to figure out what is actually happening. Unless very familiar with reading SIP trace information it is much preferred to use the Snooper utility which is part of the Lync Server 2010 Resource Kit Tools. Once this package is installed on the Lync Server then the Analyze Log Files option from the Logging tool can be used to open the converted trace text file in Snooper instead of Notepad.
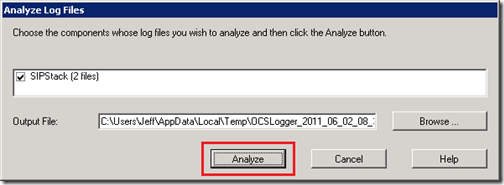
- To view the log files in select Analyze Log Files from the Logging Tool’s main window and click Analyze on the following window.
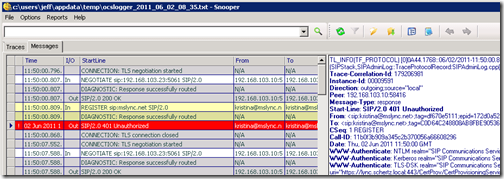
The output file will be opened automatically in Snooper. If the trace data is larger than 25MB then Snooper will prompt to only load Traces, Messages, or Both. Typically only the Messages need to be viewed for troubleshooting.
- Select the Messages tab to view the captured tracing information. (A future blog article will address the usage of Snooper as that is an entirely other topic in itself.)
Filtering Trace Files
When running trace captures in pilot or small environments it is typically easiest to just use the default settings mixed with customizing the log file size and type. But when troubleshooting issues in production Lync deployments these log files can grow very large fast and quickly become unmanageable. In these scenarios it is advantageous to utilize filtering to only capture data related to the users or systems in question by using SIP URIs or IP Addresses.
- Click the Edit button under the Filter Options section of the Logging Tool’s main window.
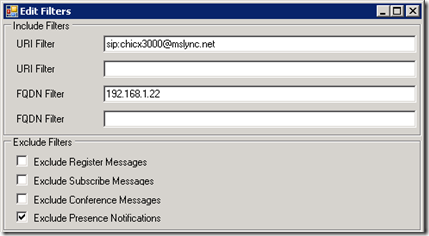
The Edit Filters window contains both Include and Exclude filters to help narrow down the captured data. As an example only data related to a specific Lync user placing calls into the Exchange UM server should be logged. So the user’s SIP URI and the Exchange UM server can be filtered for, while some unnecessary data can be filtered out for those inclusions as well.
- In the Include Filters section enter the SIP URI of the desired Lync user account under one of the URI Filter fields. (e.g. sip:chicx3000@mslync.net)
- Additionally enter the IP address (or FQDN) of the Exchange UM Server in the first FQDN Filter field. (e.g. 192.168.1.22)
- In the Exclude Filters section enable Exclude Presence Notifications to hide unwanted messages in the trace.
- Click OK to save the changes and Lync will automatically begin to apply the options to the Central Management Store and force replication between servers. This insures that all servers share the same filtering options when performing traces simultaneously on multiple servers (Front End, Director, Edge, etc).
-
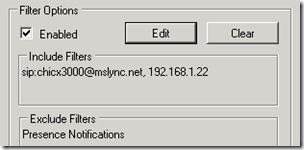
Check Enabled under the Filter Options, which will immediately kick-off replication once again. The configured filter options will appear on the main window and logging can be started.
Converting Foreign ETL Files
If an ETL file from another server or Lync environment needs to viewed usually Microsoft PSS needs to do this with a separate tool, discussed earlier in this article. But the Lync server Logging Tool actually has an executable switch to allow it to analyze log files not captured directly from that server. Normally if an ETL file was simply just dragged into the default tracing folder the tool will be unable to either recognize or open that file. But if the logging tool is manually launched with the PSS switch enabled then it will allow conversion and viewing of this file.
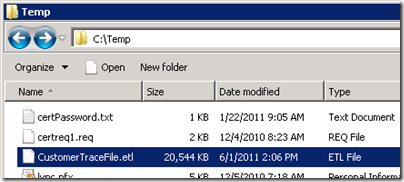
- Copy the external trace file to any directory on the same computer where the Lync Logging and Snooper Resource Kit tools are installed. (e.g. c:\temp)
- From the Windows Command Prompt launch the Lync Server Logging Tool using the PSS switch with the location of the ETL file.
"C:\Program Files\Common Files\Microsoft Lync Server 2010\Tracing\OCSLogger.exe” “/pss:C:\Temp”
Once the Logging Tool opens the Log File Folder will now display the “C:\Temp” directory specified.
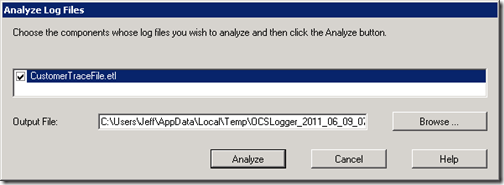
- Select the Analyze Log Files button and select the CustomerTraceFile.etl component. The Analyze button will now be available; click it to open the file in Snooper.



[…] artigo: http://blog.schertz.name/2011/06/using-the-lync-logging-tool/ mostra como utilizar a ferramenta Lync Logging, que similar a ferramenta de Logging do OCS nos […]
Very good article, I love you!
Nice job, Jeff. Given that this topic (with all of the potential options, and when/why you would choose what to log, and what flags, verbosity) you/somone/I could write a book on just how to effectively use this tool. Complex? Yes. Enough documentation on how to effectively use it and when? Not EVEN close. Hey, maybe we should do that – write a book on this? ;o)
Good write up, Jeff. I needed the "how to open an .etl" last week.. 🙂
[…] http://blog.schertz.name/2011/06/using-the-lync-logging-tool/ […]
Jeff! Ten million thumbs up for the "how to open an .etl"!
Glad it was helpful; but to give credit where it's due, Simon Booth showed me that trick 🙂
[…] either from the Front End server the Lync client is currently registered to by using the Lync Logging Tool, or by directly looking at the UCCAPI logs on the Lync […]
[…] either from the Front End server that the Lync client is currently registered to by using the Lync Logging Tool, or by directly looking at the UCCAPI logs on the Lync […]
[…] Bilgi İçin : http://technet.microsoft.com/en-us/library/gg558599.aspx Farklı Kaynaklar : http://blog.schertz.name/2011/06/using-the-lync-logging-tool/ Like this:BeğenBe the first to like this […]
Hi,
Thanks for the nice article. However i get the old logs instead of the logs during my test time. For examples, i started the log on 12:20 PM and stopped at 12:21 PM, and analyzed the log. In the messages tab, i see logs from 9:00 AM to almost 9:30 am only. Its not showing the time i tested. What could be wrong?
I have chosen New file, 100 mb.
I would delete all the files in the tracing directory before starting a new trace, as well as look into enabling filtering as you may be capturing a LOT of data.
I noticed the same thing when I was analizing the logs. To fix it, browse to the location of the log files 2 times. The second time it will stick.
Jeff:
Great article – logging as been "re-structured" in Wave15, but do you know if we can use the OCSlogger.exe in Wave 15 ???
Yes, the logging tools have been moved but should still be supported in addition to the new logging features.
Will the procedure above also work for trouble shooting routing / call handling issues from Lync Response groups? We currently have an issue where Response Group members cannot pick up the call (it rings at the user end but call answer fails).
It should, any SIP traces can be captured this way.
Hi, On Lync 2013 mediation-server on at least to systems it seems that the sipstack tracing is missing from the options in lync logging tool. However on the lync front end server the sipstack tracing is available.
The only option I have found is to trace sipstack on mediationserver via the CLS logging in powershell.
Is there any way of getting sipstack tracing back in lync logger on mediation?
Not that I'm aware of. I suggest bringing this up to Microsoft directly.
Hi Jeff, Which are the tags to be enabled to troubleshoot presence issues for specific set of users, will SIPSTACK capture it. Please advice.
SIPStack and S4 are the best place to start. I don't know if any of the other sources can be used to show any further presence related information.
Jeff, you might post this above so more people can see it. It's a bug that I wasted hours trying to figure out why the Lync Logger wasn't working:
http://blogs.technet.com/b/dodeitte/archive/2013/…
Hello Jeff,
Can you please post the link for next article mentioned above.
Thanks,
Amit.
There referenced article has not been written. Not sure if I will still do one as there are plenty of resources already out there which cover the use of Snooper, like this series for example: http://blogs.technet.com/b/nexthop/archive/2012/0…
Is it possible to log the presence changes of a contact?
A bloody good read – I can now: launch logging with or without PSS switch to view external logs, view logs in messages – (which is the one you want) I can set filters of the URI or IP I want to look at and view them, set the re-writing limit of the log files themselves (set them to a larger capacity), start and read the call flow window. Most of all I understand how it works as a central Logging service.
All this is less than an hour – totally sunk in and understood – Cheers Jeff – you just kept a roof over my kids heads for another 3 months at least!!
You the man!
Hi Jeff,
Thank you for posting this information. I have one question, can this trace pinpoint issues as well with problems we are having with audio conferencing where on some occassions, we get the error “Invalid Conference ID” after punching in the conference ID? When we hang up the phone and try it again, we dont see the error message anymore. It is like a hit or miss game. Sometimes it works, sometimes not. And we are beginning to suspect that there is something wrong with DTMF translations.
Best regards,
Bernie
Will you publish some document on snooper for Lync Client troubleshooting.
Sorry, I wasn’t planning on anything outside of this article. There are various other articles on this topic available on other blogs though if you search around.
Hi Jeff,
Just wondering whether there is the option when searching logs using Powershell to output the info based on the SIP address of the? As in the -identity? I have tried a few different approaches but no luck!
Any pointers?
Thanks
Hi Jeff.
I’ve noticed that in newer Versions of the Snooper Tool (5.0x, Lync 2013) the “Reports” Menu has been removed.
It was actually pretty handy to run a quick Report against the SQL DB. To get quickly an info about certain Conferences or Users. By Chance any idea where it has been gone or if there’s an replacement?
Thanks a lot for your ongoing work on writing great articles. I’ve learned a lot from them!!
Greetings from Berlin
Torsten 🙂
Hi Sir,can we lync server logging tool to troubleshoot audio video voice qualit issue, if yes what parameter.