Using tools like Network Monitor and Wireshark are common place when dealing with troubleshooting issues in Lync Server or when simply attempting to better understand some specific behavior.
As Wireshark is more commonly deployed and often already installed on customer’s servers then it can be beneficial to understand a few basic quirks so that one can dive right into looking at the traffic. These issues range from simply starting the capture driver to modifying and filtering the output.
Customizing the Display
Although Wireshark has a number of benefits over Network Monitor the least beneficial issue with using Wireshark out-of-the-box is that it can be hard to quickly identify traffic due to the default display behavior. For some reason the network ports are not listed in the default columns like they are in Network Monitor, and Wireshark also incorrectly marks a lot of traffic with bad checksums.
Adding Port Columns
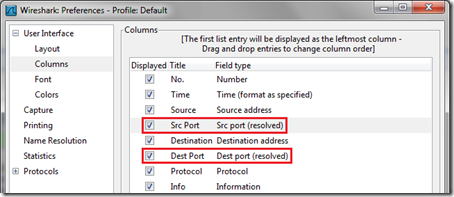
This should be the first change applied to Wireshark after installation and makes it much easier to read through traffic as the source and destination ports can be as important as the host IP addresses.
- Open Preferences from the Edit menu and expand the Columns item. Using the Add button at the bottom create two new columns and for their field types select either the resolved or unresolved selections for both Src port and Dest port types. Also double-click the Title fields to rename the columns.
The (unresolved) entry will simply show the raw port number (e.g. 5061) while the (resolved) entries will show the port information as a descriptive name if it can be resolved as a known defined port (e.g. sip-tls).
Once these changes are saved then the main Wireshark window will display the new columns.
Bad Checksum Errors
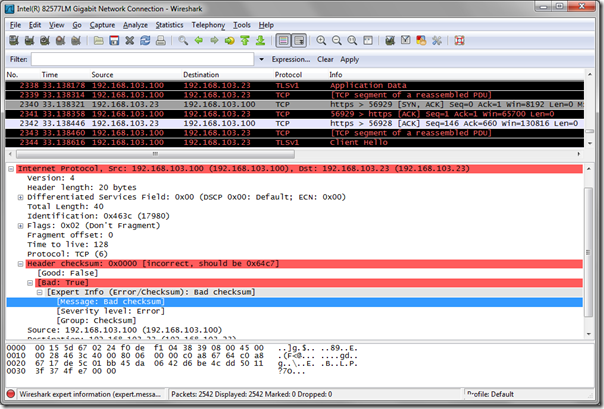
When looking at captured traffic often all outbound packets will be highlighted in red/black and the Header Checksum details for each packet are reported as incorrect. This is typically due to the fact that most modern network interface cards support TCP offloading which means that the checksum data is actually calculated by the NIC and not by computer’s primary processor. But since Wireshark has to capture the traffic before it leaves the operating system for the NIC then the checksum data for every outbound packet will be null at the time of capture. The Header Checksum line in the following screenshot indicates this as it reports “0x0000 [incorrect, should be 0x64c7]”.
Now this topic has been covered by many articles since the release of Wireshark and is even discussed in the Wireshark FAQ but in the more recent versions of Wireshark these documented resolutions no longer seem to resolve the display issue. Most of the older blog articles covering this topic instruct the reader to disable the Validate TCP or UDP checksum settings in Wireshark, but current versions of the software already have this option disabled by default.
- To validate this open Preferences from the Edit menu and then expand the Protocols list. Look at the settings for both TCP and UDP protocols to see that the “Validate the <protocol> checksum if possible” settings are both already disabled.
After some digging around an additional step was identified which finally resolved the issue of incorrectly displaying all outbound traffic with checksum errors.
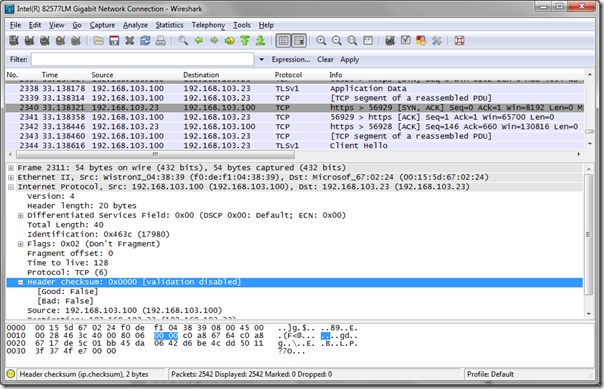
- In the same Preferences window locate the IP settings and then uncheck the Validate the IP checksum if possible setting which is enabled by default.
As soon as this setting is turned off then the displayed color of outbound traffic will immediately change in the captured traffic window, as shown below. Note that in the highlighted Header Checksum line Wireshark reports that validation is now disabled.
NPF Driver Startup
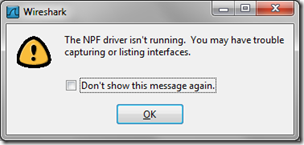
During the initial Wireshark installation the WinPcap NetGroup Packet Filter (NPF) capture driver wizard prompts the user to select whether or not the NPF driver is started automatically with Windows. If this option was disabled then when Wireshark is launched the following alert will appear.
There are two ways to resolve this issue: either manually start the driver each time Wireshark is used or configure the driver to start automatically when Windows is booted.
Manual Startup
- For the manual approach open the Windows command prompt with Administrator privileges and enter the command net start npf to start the driver.
Automatic Startup
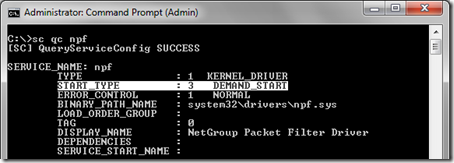
- To configure automatic startup open the Windows command prompt with Administrator privileges and enter the command sc qc npf to first identity the current status of the START_TYPE parameter.
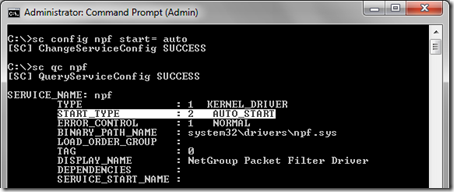
- Then from the same command prompt window enter the command sc config npf start= auto to configure the driver to start automatically with Windows.
Be aware that the command above includes an intended space between the equal sign and the auto value which is required by the sc command. If the space is not entered after the = then the command’s help description will instead be output which includes a note explaining that “a space is required between the equal sign and the value.”
Also note that only setting the driver for automatic startup will not actually start the service until Windows is rebooted so if Wireshark is to be used right away then run the manual start command as well.
Filtering Traffic
Filtering traffic in Wireshark falls into one of two main categories: Capture Filters and Display Filters. When grabbing short intervals of traffic it is easiest to just capture everything (like during a Lync voice call) and then utilize display filters after the capture is stopped to drill-down to the pertinent traffic.
Since there is no ‘show Lync stuff’ filter then how the traffic should be filtered is the first step. By IP? Or by protocol? Or by port? Any and all of these can be used depending on what is being looked for in the traffic.
Traffic was captured using Wireshark on a Lync workstation (not from a server) during the following example scenario:
- A Windows Lync 2010 client on the host IP address of 192.168.103.100.
- A Polycom CX3000 Lync Phone Edition device on the host IP address of 192.168.103.104.
- A Lync Standard Edition Front End server located at 192.168.103.23.
- A standard peer-to-peer audio call was placed from the Lync client to the CX3000 and answered within 2 rings.
- After 30 seconds the CX3000 disconnected the call.
Display Filters
Before looking at any individual filtering commands the basic syntax used by the Wireshark filter field needs to be briefly reviewed as it is a bit quirky and may seem a bit foreign to anyone used to Network Monitor. Comparison Operators are supported in either English or C-Like formats, so either ‘eq’ or ‘==’ can be used to filter for an exact match. A benefit of the Wireshark filter field is that anytime an invalid string is entered the field will display in red, but if the current string is valid it will display in green. This helps to immediately show when a mistake or invalid format is used. The examples below will use eq and == interchangeably.
- To quickly identify where the SIP signaling traffic in a call is routing to set the filter to tcp.port eq 5061 and displayed is only outbound traffic from the local client (.100) to the Lync server (.23) and inbound traffic sent from port 5061 on the Lync server. Notice that there is no traffic between the two Lync endpoints (.100 and .104) over 5061 as all signaling is handled by the Lync Front End server.
tcp.port eq 5061
- To identify the media traffic flowing between the Lync clients clear the previous filter and then enter ip.addr==192.168.103.104 to locate any traffic between the Lync client (.100) and the CX3000 (.104). To further filter for traffic by source or destination replace ip.addr with either ip.src or ip.dst.
ip.addr==192.168.103.104
ip.dst==192.168.103.104
Capture Filters
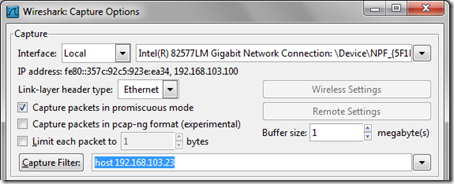
To reduce the size of capture files over long periods of time or to only capture at traffic of a certain type then it can often be a better approach to simply define a capture filter.
- From the Capture > Options menu in Wireshark simply enter the desired filter string as shown below. The Capture filter button will display the default filters available and the examples there can be used to create a customer string. In this example the string host 192.168.103.23 was entered so that only traffic to/from the Lync Front end server will be captured.






[…] Wireshark Capture Tips: http://blog.schertz.name/2011/10/wireshark-capture-tips/ […]
[…] Wireshark Capture Tips: http://blog.schertz.name/2011/10/wireshark-capture-tips/ […]
[…] Using tools like Network Monitor and Wireshark are common place when dealing with troubleshooting is… […]
good job man
like normal life. u have to listen first to find the answers 🙂 thank you for this article.
very helpful… like
How to decrypt the SIP TLS stream?
You'll need to load the Lync server certificate into Wireshark to read the encrypted TLS traffic. This previous article discusses that concept in more detail: http://blog.schertz.name/2010/10/lync2010-client-…
[…] Wireshark Capture Tips : Jeff Schertz’s BlogOct 5, 2011 … Using tools like Network Monitor and Wireshark are common place when dealing with troubleshooting issues in Lync Server or when simply … […]
[…] following test scenario uses Wireshark but the same process can be used with other network packet capture […]
how to lync caculate checksum? it 35 byte?
Excellent article, very helpful
Just a quick note about the Checksum info. In more recent versions of Wireshark, it's not listed as IP. It's listed as IPv4 and IPv6.
Thanks for the update. They seem to change something like this in every other Wireshark release 🙂
Thoughtful post . I Appreciate the specifics – Does someone know if I could possibly obtain a template a form form to work with ?
This has always been an awesome reference for WireShark. I’ve now automated setting these parameters to make it easy during deployments. See the article at http://www.ehloworld.com/3156